
✔ Available
on Scale subscriptions 1
Within Teamwork.com, a series of advanced
dashboard features are available to accounts
on the Scale subscription plan.
Projects distribution panel
When creating a new dashboard or editing
an existing one, you can
choose Projects Distribution as a panel option.
This panel will give you a breakdown of how
your projects are distributed based on the
grouping selection you choose.
You can group by:
- Project owner
- Category
- Company
- Portfolio
- Portfolio column

At the bottom of the Projects Distribution
settings, you can choose whether to apply your
overall dashboard filter settings, or pick
custom filters specific to the panel.
Once you have saved your dashboard, you will
see your new projects distribution channel
displayed in a bar chart.
As an example, if your distribution is based
on project owners, you will be able to see how
many projects each user is assigned to. The
bars will be grouped by project status.
Clicking a section of one of the bars will
open a quick view listing the corresponding
projects.
In the top right of the Projects Distribution
chart, click the three dots to edit, delete,
or customize the panel.

Activity breakdown panel
Another advanced panel you can add to
your dashboards is Activity
Totals.
This panel will give you a breakdown of
activity totals and how they are
distributed based on the grouping
selection you choose.
You can group by:
- User
- Project
- Item type

At the bottom of the Activity settings,
you can choose whether to apply your
overall dashboard filter settings, or pick
filters specific to the panel.
When you toggle off the Use
Dashboard filter settings option,
a series of custom filter options will
appear such as project status and project
health.
The bars will be
grouped based on your selected
preference (user, project,
item type), and
the bars will be
sorted in order
of most
recent
activity
date. Clicking
a section of one of the bars will open a quick
view listing the corresponding activity
items.
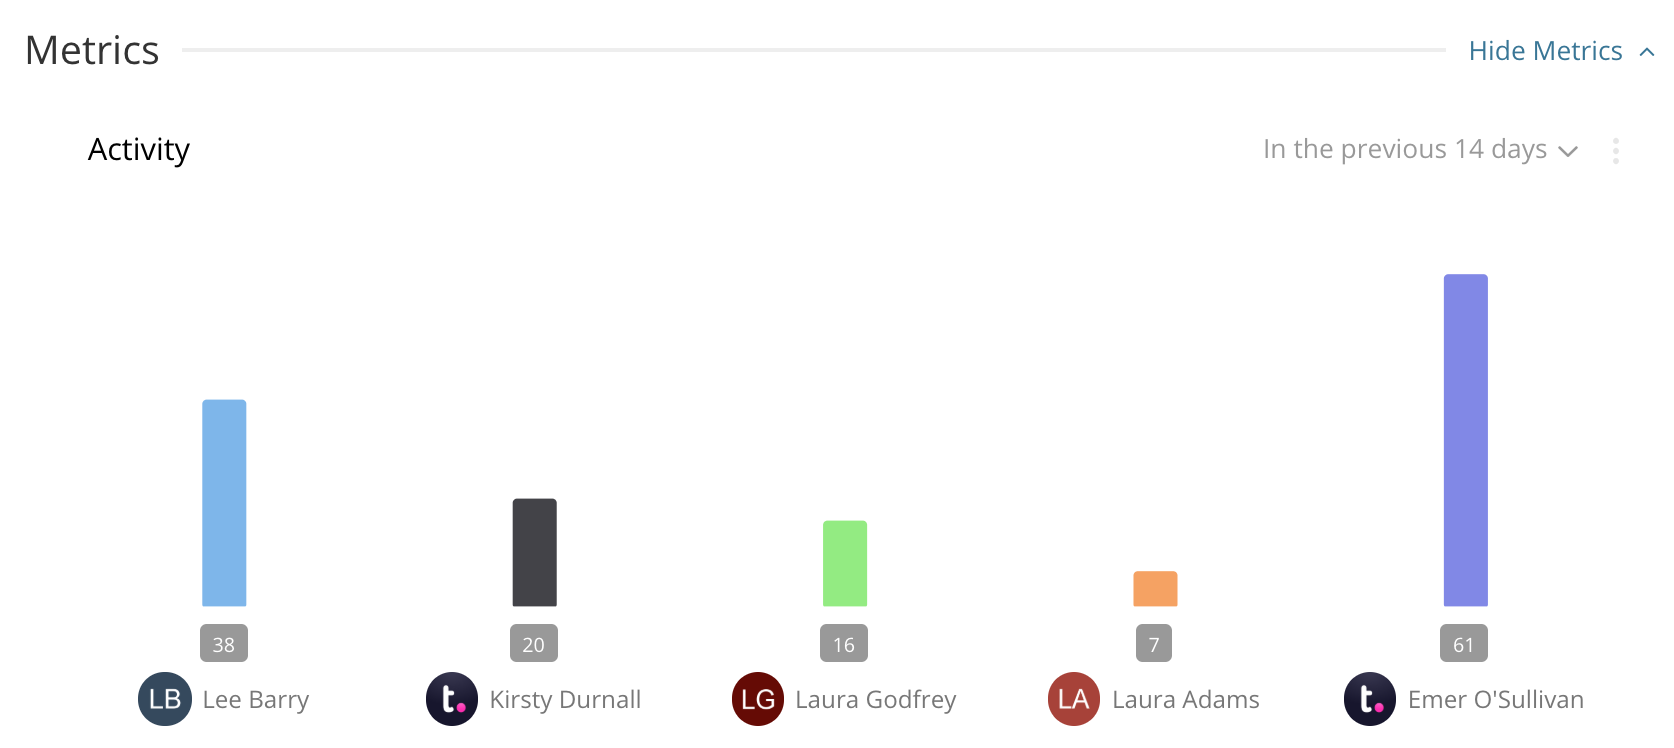
To the top right of the Activity panel, you
can alter the date range the activity
displayed is based on, up to the previous 30
days.

Manage dashboard panels
Each panel in your dashboard has an
options menu (three dots) in the top
right, which allows you to manage the
panel.
Via this menu, you can edit, delete, or
duplicate the panel.

Panel display options
When you choose the Edit option on a
panel, a modal will open with sections for
Filters and Display.
In the Display tab, you can choose a
custom view mode:
- Display in grid
- Display as full width
- Some panels such as the Projects
Distribution will always display
as full width.

Below the view mode, you can also choose
which values should be displayed in the
panel. The values available will change
depending on the type of panel
selected.
As an example, if you have a panel based
on project health, you can choose which of
the project health types should be
included and which should be hidden.
For the Projects Distribution panel, you
will see an additional display option to
choose how the columns in the chart should
be displayed.
- Side by side - have separate columns
for each project status, per
user.
- Stacked - stack the different project
statuses on top of one another so each
is represented by one bar.
- As percentages - the stacked project
bars in the chart will include a % of
the user's overall projects when you
hover over the bar.

For project budget
panels, you can customize the
ranges of budget usage to be displayed.
Hover over an existing range to edit or
delete it. You can also set a new range by
clicking Add Range at the
top of the ranges list.

Multiple panels of the same type
In each dashboard you create, you can add
multiple versions of the same panel type,
meaning you can get an overview of
particular metrics based on different
conditions.
When creating or editing a dashboard, use
the panel type dropdown to select the
relevant panel. Click Add
Panel to add it to the list
of panels before updating the dashboard.
As an example, you could add three task
counts panels, each based on different
assignees: me, specific people, and
everyone.

You can also add another column of the
same type by using the duplicate option on
an existing panel.

Filter dashboard panels
When adding panels to your dashboards,
you can choose a filtering option:
- Use the dashboard's overall filter
settings
- Choose custom filters specific to the
individual panel - toggle off
the use dashboard filter
settings option to access the
custom filters.

The custom filter options available
include:
- Project status
- Project owner
- Project health
- Project tags
- Company
- Project category
- Options - show starred projects only
You can also update the applied
filters by clicking the panel's edit option
and selecting the Filters tab.

1. Also available on legacy subscriptions: Enterprise.