
Within Teamwork CRM, you can use company reports to get an overview of your deals and activities.
To view your company reports, select Reports from the navigation bar and choose Company from the dropdown.

Each report in the Company Reports area generates a URL based on the options selected, working similarly to a saved filter. This means it is possible to bookmark your report to keep the options saved, or share the URL for others to use the same reporting options.
In each reporting section, it is possible to view your data via a bar chart or a line graph using the view switcher in the top right corner of each area.
Deals
Using the left-hand menu, you can choose which types of deals report to view.

Deals created
The deals created area will display all of your company's deals created in bar chart or line graph form, broken down by total value per creator.
At the top of the report area, you can use the dropdown filters to customize which information to include. Using the Export button in the top right, you can also export in Excel format.
You can set the report to be based on:
- Product or creator
- Number or value
Pipelines can be filtered to:
- All pipelines
- All lead pipelines
- All opportunity pipelines
- Custom pipelines
The report can also be filtered by time frame. Options include today, this week, last quarter, or custom.
When viewing the bar chart, you can use the toggle option for Showing/Hiding current status of each deal in the report.
Below the chart, you can see all the details in list view depending on the options previously selected.
Leads qualified
The leads qualified report can also be displayed in bar chart or line graph form.
At the top of the report area, you can use the dropdown filters to customize which information to include. Using the Export button in the top right, you can also export in Excel format.

You can set the report to be broken down by:
- Owner or product
- Value or number
Pipelines shown can be filtered to include:
- All leads pipelines
- Custom leads pipelines
The report can also be filtered by time frame, with options including yesterday, this week, and last month.
Below the chart, you can see all the details in list view depending on the options previously selected.
Opportunities won
The opportunities won report can also be displayed in bar chart or line graph form.
At the top of the report area, you can use the dropdown filters to customize which information to include. Using the Export button in the top right, you can also export in Excel format.

You can set the report to be broken down by:
- Owner, product, or won reason
- Value or number
Pipelines shown can be filtered to include:
- All opportunities pipelines
- Custom opportunities pipelines
The report can also be filtered by time frame, with options including yesterday, this week, and last month.
Below the chart, you can see all the details in list view depending on the options previously selected.
Deals lost
As with all company reports, data here will be displayed in either a bar chart or line graph form.

You can set the view to be based on:
- Owner
- Product
- Stage
- Pipeline
- Lost reason
- Value or number
Pipelines can be filtered to show:
- All pipelines
- All lead pipelines
- All opportunity pipelines
- Custom pipelines
Time frame filtering is also available, allowing you to view reports based on periods such as last week, this year, or custom.
Below the chart, you can see all the details in list view depending on the options previously selected.
Leads and Opportunities velocity
The velocity reports are based on closed deals, meaning only leads or opportunities that were qualified/won or lost during the selected timeframe will be included.
- Deals closed before or after the selected timeframe will not be counted.
- Only the history of a deal that occurs during the selected timeframe will be shown for each deal.
- A deal cannot be represented in each stage more than once. If a lead has moved to a stage more than once, the total number of days it was in the stage will be shown in a single entry.
Activities
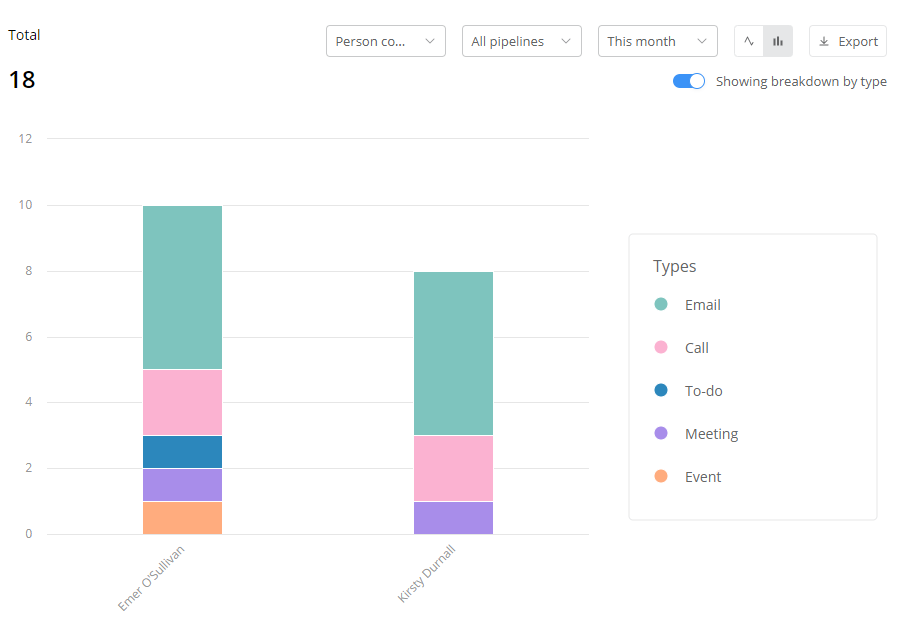
View activities completed or activities created. Both activity reports will show you activities broken down by in bar chart or line graph form.
Filter options available are:
- Person or type
- Activities completed - Person completed
- Activities created - Person created
- Pipelines
- All pipelines
- Custom pipelines
- Time frame - today, last week, custom, etc.
You can choose to show the breakdown by type or hide breakdown type using the toggle option in the upper right in bar chart form.
To export via Excel, select Export from the upper right corner.
Below the chart, you can see all the details in list view depending on the options previously selected.
For more information, see: Using Forecast Reports