
Within Teamwork CRM, you can run forecast reports over custom time periods.
Click Reports from the navigation bar and choose Forecast from the dropdown menu.

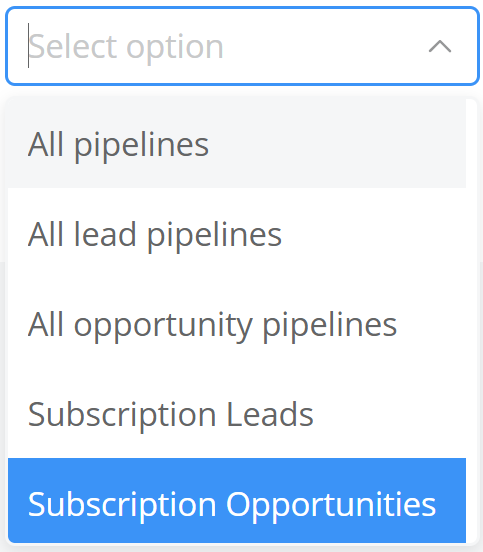
In the top left of the Forecast reports area, you can select which pipeline(s) you would like to view.
Options here include:
- All pipelines
- All lead pipelines
- All opportunity pipelines
- Custom pipelines
The date range in which a card is displayed is determined by the deals won/lost or expected close date.
Hovering over a column bar will display a popup outlining the total won and open values for that particular column. The percentage displayed is a calculation based on the probability set for the stage each deal is currently on within its pipeline.
Example:
- 96% of the total value of the cards within this column has come from won deals.
- 4% of the total value of the cards within this column has come from open deals.

The card view within a column will display:
- Deal name
- Owner
- Value
- Company
- Won (if marked as won)
- Activity
- Stage

Options
The options dropdown menu is located to the upper right of the Forecast reports area and allows you to customize how your columns and cards are displayed.
The options available are:

Note: Score is based on value versus stage probability.
Filters
You can customize which results are displayed using filters. Filters can be accessed by clicking the filters button to the right of the options menu.

The time frame currently displayed on-screen can be adjusted using the timeline navigation located in the top right of the Forecast area.

 | Moves your time frame by a full screen to the left |
 | Moves your time frame by one column to the left |
 | Resets your view to today's current week, month, or quarter |
 | Moves your time frame by one column to the right |
 | Moves your time frame by a full screen to the right |
For more information, see: Company Reports