
✔️
Available on
all subscriptions.
| What | View an individual
client's key
data (like
activity, project
health, and more). |
| Why |
|
| Who |
|
| When | If
you are a
client
services
company that
provides
client work,
you
can:
|
| What | View an individual
client's key
data (like
activity, project
health, and more). |
| Why |
|
| Who |
|
| When | If
you are a
client
services
company that
provides
client work,
you
can:
|
Overview tab
✔️
Profitability, Budget breakdown, and
Billable vs non-billable time widgets are
available on Grow and Scale
subscriptions.
What it
shows: Widgets displaying data
related to all of the client's
projects.
How to
use it: Spot trends,
understand how work for the
client is progressing, and
plan adjustments to keep
projects on track. Basically:
get total visibility of
the state-of-play for each
client and their
projects.
🔑
Site
admins (in the
owner
company) and the client's client owner can
access a client's Overview tab.
- Select Clients from
Teamwork.com's main
navigation
menu.
- Search for and
select a
client.
The Overview tab is selected
by default in the individual client
view.
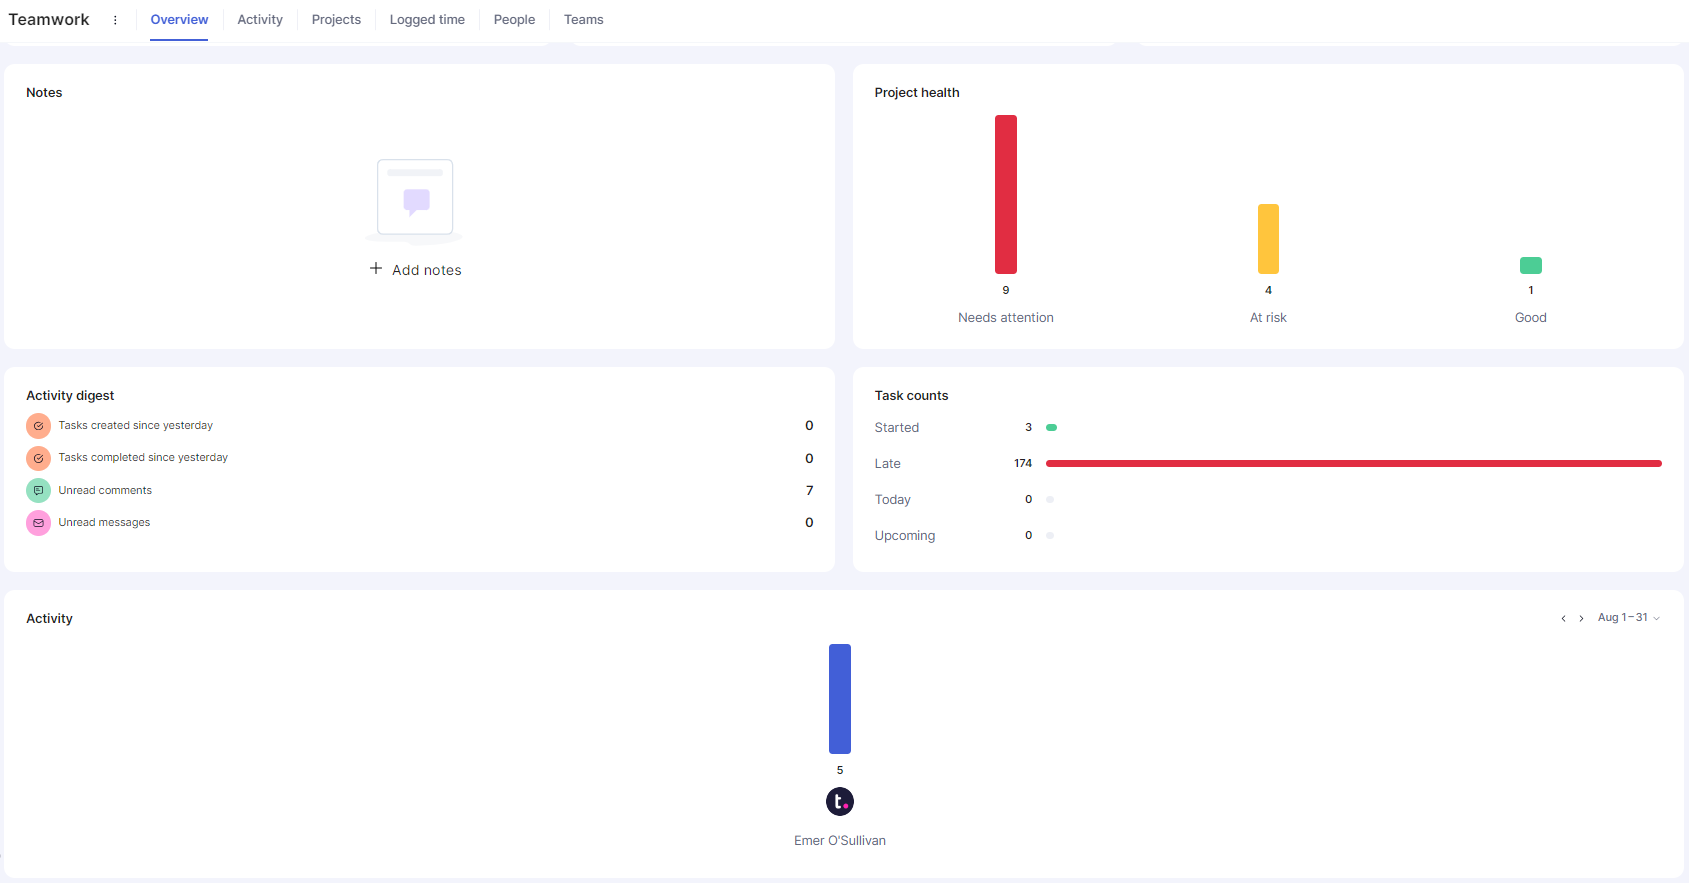
The Overview is
comprised of a series of widgets (outlined
in the table below).
| Widget | Description |
|---|---|
| Notes | A text
field
where you can
add notes with
any important
client
information.
Anyone with
access to the Overview tab
can add and
read
notes. |
| Project Health | Bar
chart
displaying
how
many
of the
client’s
projects
fall
within
each project
health category. |
| Activity digest | Quantity of:
tasks
created
since
yesterday,
tasks
completed
since
yesterday,
and unread
comments
and
messages
across all
of the
client’s
projects. |
| Task counts | Task counts for:
started,
late,
today
(due), and
upcoming
for this
month. |
| Activity | Bar
chart
breakdown
by user
tracking
how many
client-related
activities
someone
has performed. Quickly
see
who is
most
active
on the
client’s
projects. |
| Profitability | A client’s
profitability-related
metrics:
|
| Budget breakdown | A bar
graph
breaking
down how
many of
the
client’s
projects
fall
within
specific
budget
usage
percentages. |
| Billable vs non-billable
time | Gauge
chart
displaying
a split of
the
billable
and
non-billable
time
logged for
that
client
across all
of their
projects. |
Interactive
widgets
Want to drill-down and see more
detail? Some widgets are interactive,
allowing
you to click on individual results and see a
breakdown of the data provided.
Interactive widgets:
- Project Health
- Activity
- Profitability
- Budget breakdown
- Billable vs non-billable time