
| What | Report on how team members are performing based on ticket interactions. |
| Why |
|
| Who |
|
| When | A department
lead wants to better
understand agent workload
and ticket-solving
effectiveness. Example: As a
marketing manager, use the
advanced filters to drill
down the report to
specific agents on your
team. |
| What | Report on how team members are performing based on ticket interactions. |
| Why |
|
| Who |
|
| When | A department lead wants to
better understand agent
workload and their
ticket-solving
effectiveness. Example: As a
marketing manager, use the
advanced filters to drill down
the report to specific agents
on your team. |
Before you
start
Applying the following affects the data
displayed in Team reports:
Access Team reports
Team reports can be found in the
site-level Reports area.
- Click Reports in the main
navigation.
- Select the Team tab.

Customers
helped
Timeline showing the volume of
customers that have had at least one reply on any of their tickets during
the selected date range.
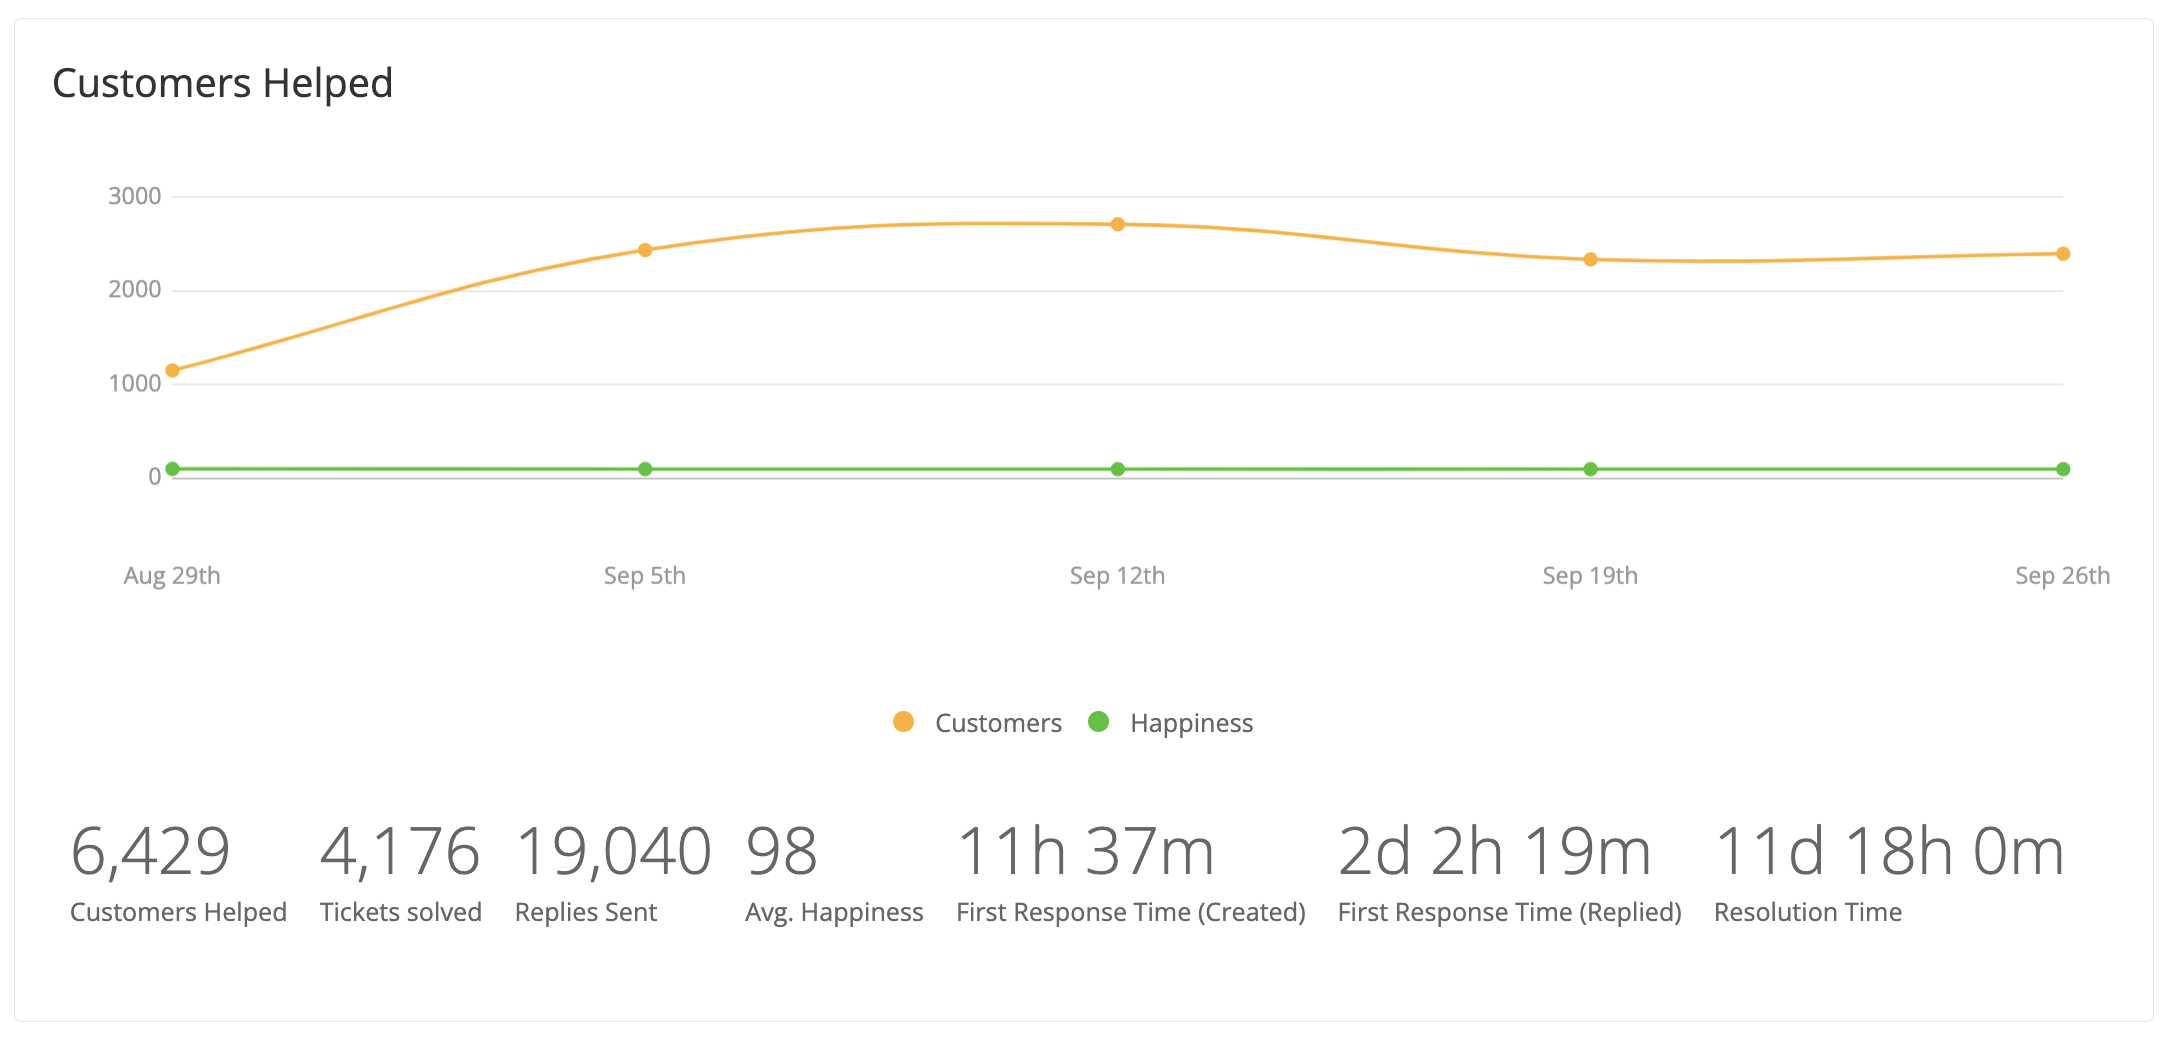
| Metric | Purpose |
|---|---|
| Customers helped | Count of customers that have
received at least one agent
reply on any of their tickets
during the selected
period. |
| Tickets solved | Count of tickets whose status
has been set to solved.
|
| Replies sent | Count of the total number of agent
replies sent during the selected
date range. |
| Average happiness | Average happiness % across
all ratings received, based on
the following formula: Average happiness =
(sum of the score) / (number
of ratings)
|
| First response time
(created) | Based on tickets created and
replied to during the selected
date range. |
| First response time
(replied) | Based on tickets created
anytime, with a first response
during the selected date
range. |
| Resolution time | The average time taken for a
ticket to go from created to
closed or solved. |
If a comparison date range
is used, the increase or decrease in
each metric between the two periods is also displayed.
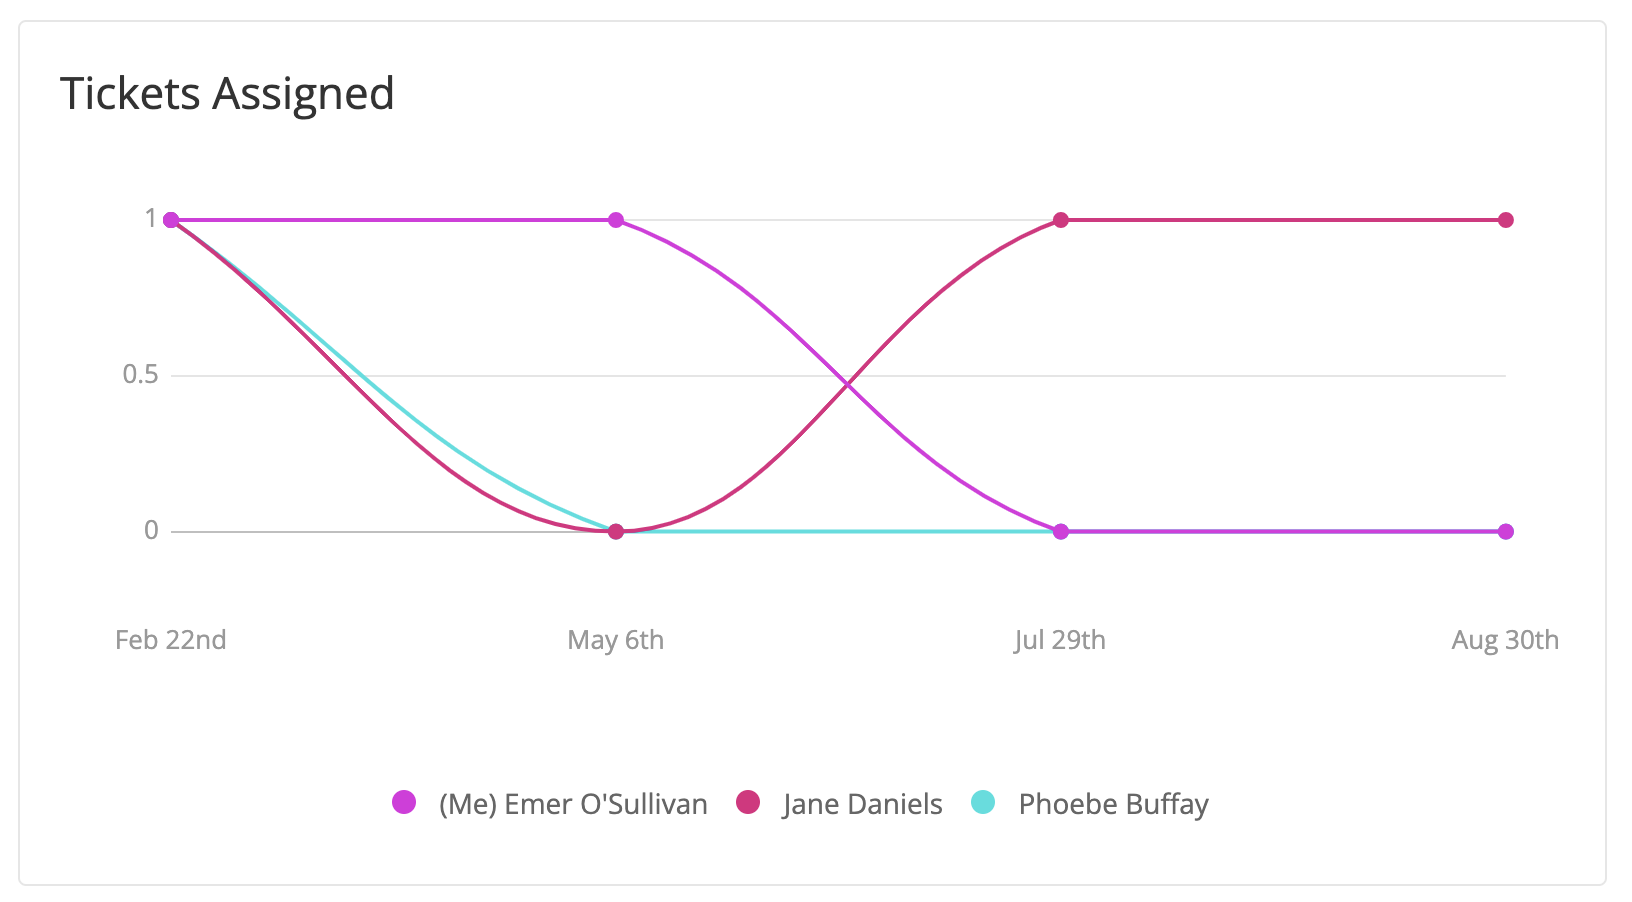
Tickets
assigned
Shows the number of tickets that have
been assigned to each agent on a
given day across the selected date
range.
📝 This is based on the action
of tickets being assigned to the agent
over the course of the period, not the
number of tickets currently assigned
to the agent.
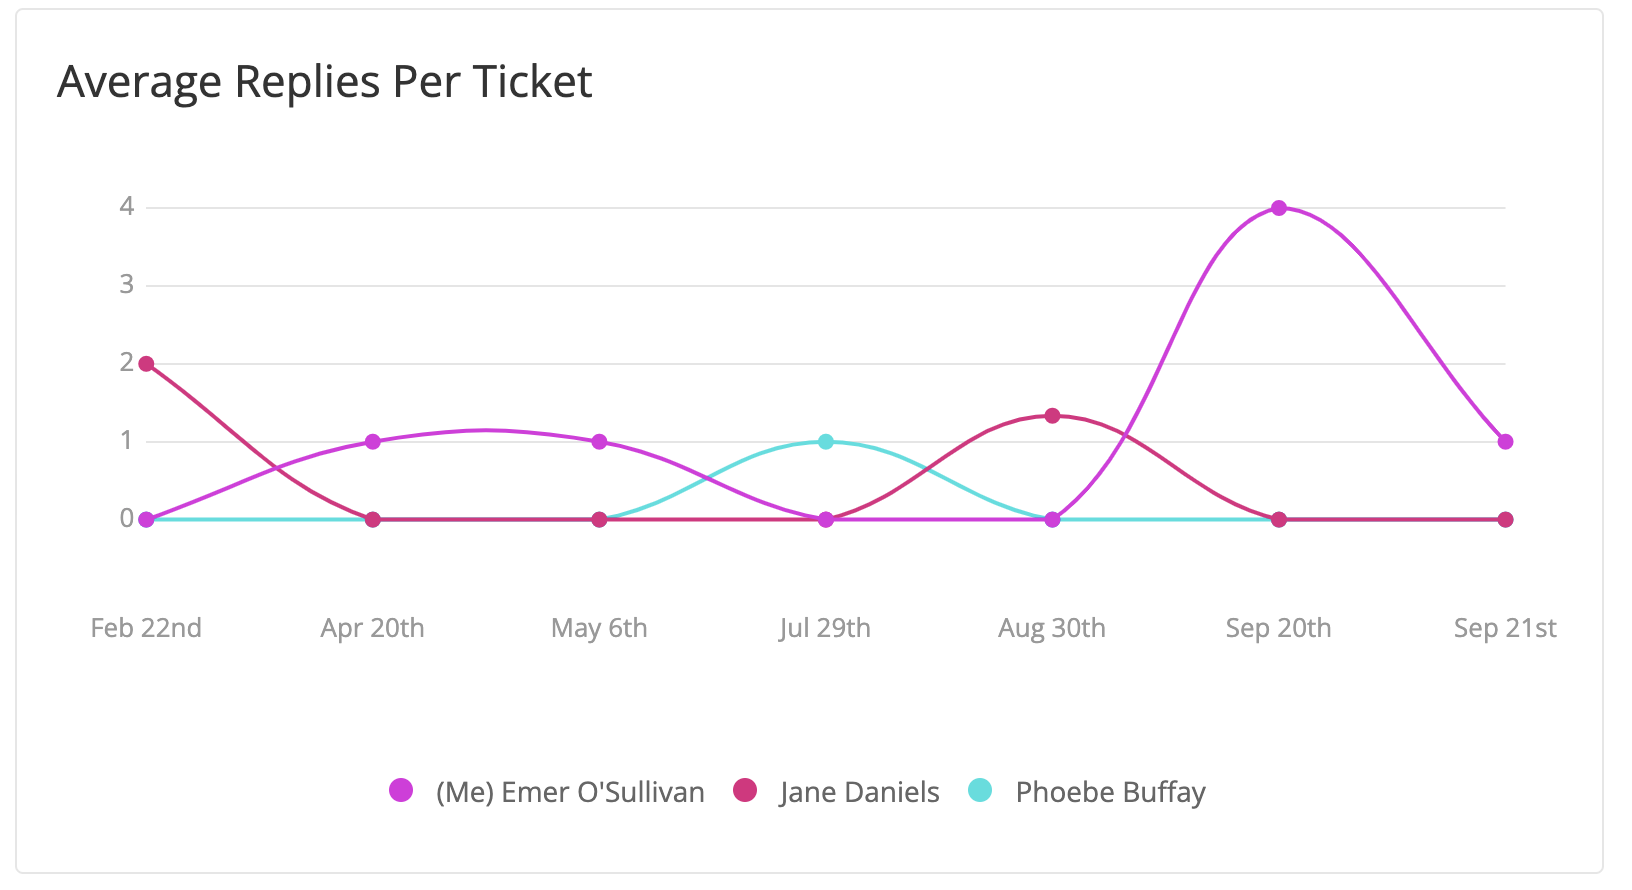
Average
replies per ticket
Displays the average replies agents
have made per ticket in a given
period. This is based on their total
replies and number of tickets
interacted with in the period.
Example: An agent makes 20
replies across 10 tickets today. This
will be displayed as an average of two replies per ticket for today.
Agents
Shows a list of the agents
on the Teamwork Desk site and
corresponding insights into their
performance.
| Metric | Purpose |
|---|---|
| Replies | The number of replies the
agent has made in the selected
period. This does not
include notes added to
tickets. |
| Tickets helped | The number of tickets
that the agent has marked
as solved in the selected
period. |
| Customers helped | The number of unique customers
(defined as one customer per
ticket) that an agent has
interacted with during the
selected period. |
| Resolution time | The average resolution
time of tickets the agent
has worked on during the
selected period
(regardless of
assignee). |
| Happiness score | The agent's overall
happiness score across all
of the tickets they have
interacted with, defined
by the score on those
tickets. |