
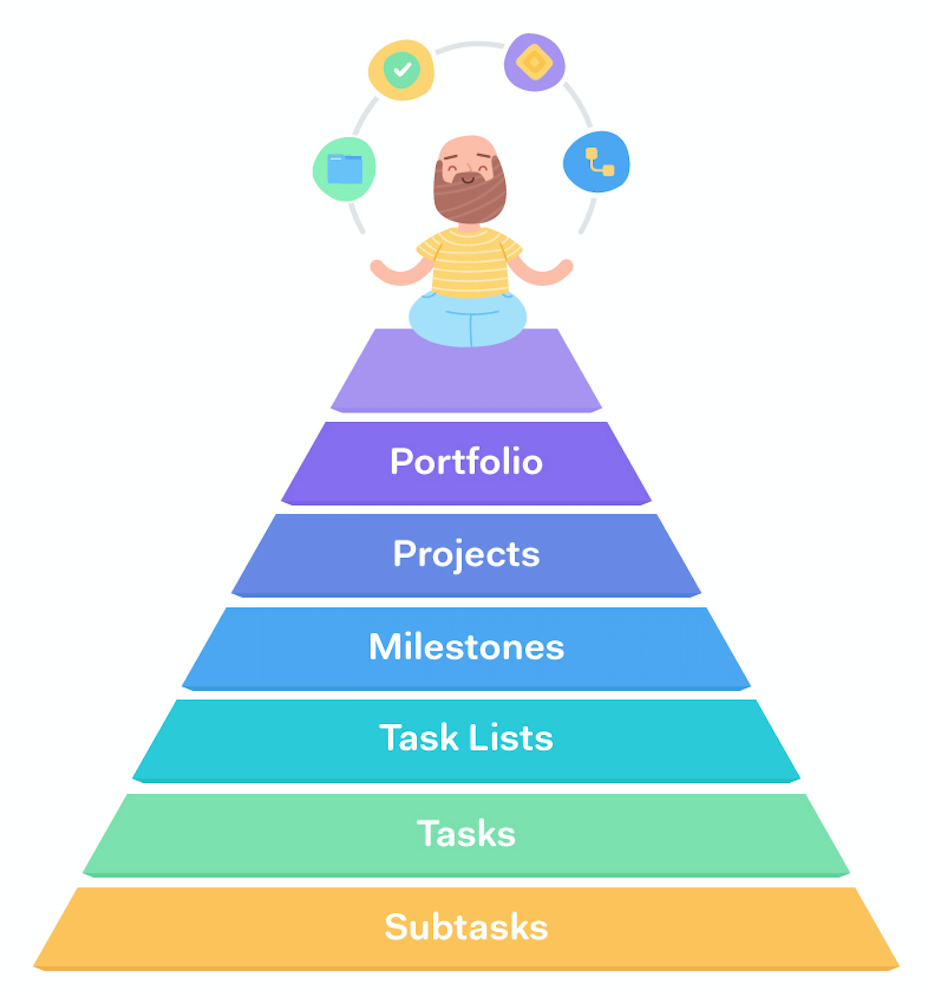
Within Teamwork.com, there is a hierarchy of information that forms the basis for your projects.
Tasks are the basic units of work in Teamwork.com that need to be completed by members of the project.
You can break the work down further by creating subtasks.
Tasks cannot be added to a project without being associated with a task list. You can use task lists to group and manage your tasks.
Multiple task lists can be created in a project, and you have the option to associate each list with a relevant milestone.
A milestone marks a point of progress in your project such as the end of a phase of the project.
You can attach one or more task lists to a milestone to show a set (or sets) of tasks that need to be completed in order to reach that milestone.
Each project you create is made up of all the components below it in the hierarchy. These include:
- Subtasks
- Tasks
- Task lists
- Milestones
Your overall goal to complete the project by working through and completing each of these components, working from the lowest level of subtasks (if created) through to milestones.
You can use Portfolio view to see how many projects you may have running concurrently are progressing.
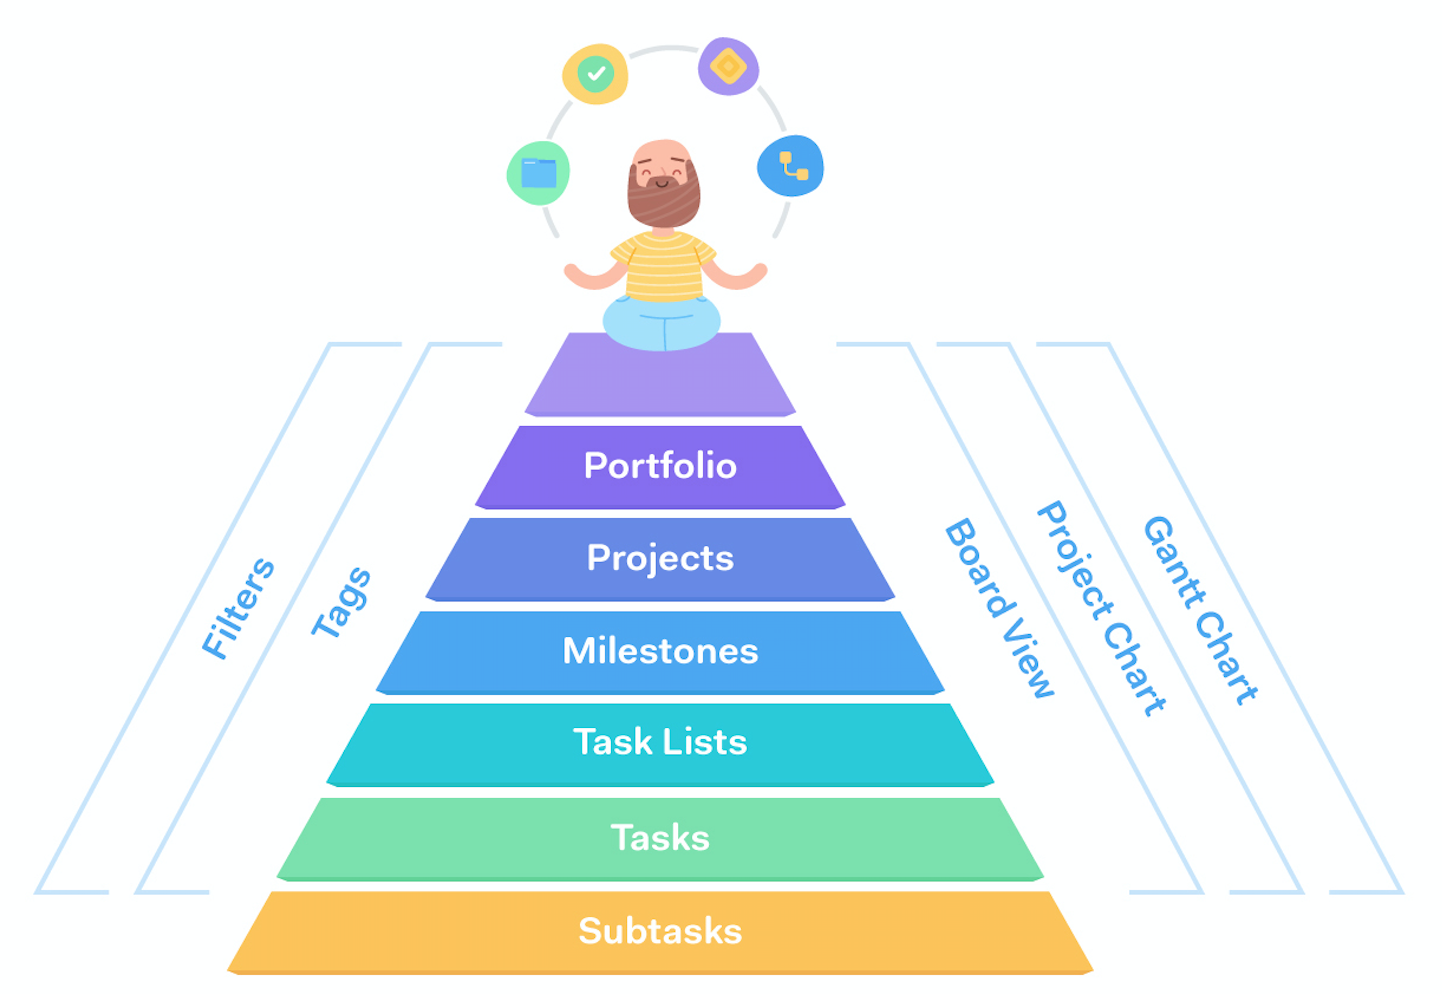
In most project and site-level areas of your site, you can used the advanced filters pane to customize the information shown.
The filter options available to you will change depending on the area of your site you are viewing.
You can use tags for various items such as tasks, time logs, milestones, and projects. Applying a tag allows you to add custom identifying markers to your items.
Once an item has been tagged, you can use both filters and search based on tags to find items of relevance. You can also choose specific colours for each tag to help differentiate them.
Board view allows you to visually represent your tasks' journey as they move through a process.
Cards represent your tasks in board view, and can be moved through the custom columns you create to represent the different stages of the project.
The projects chart gives you a timeline representation of your projects in one place, highlighting each project's duration as well as any milestones.
The Gantt chart gives you a timeline view of an individual project.
Tasks are represented in bar format indicating their duration based on start and end dates. Any milestones attached to task lists will also be shown in the Gantt chart.
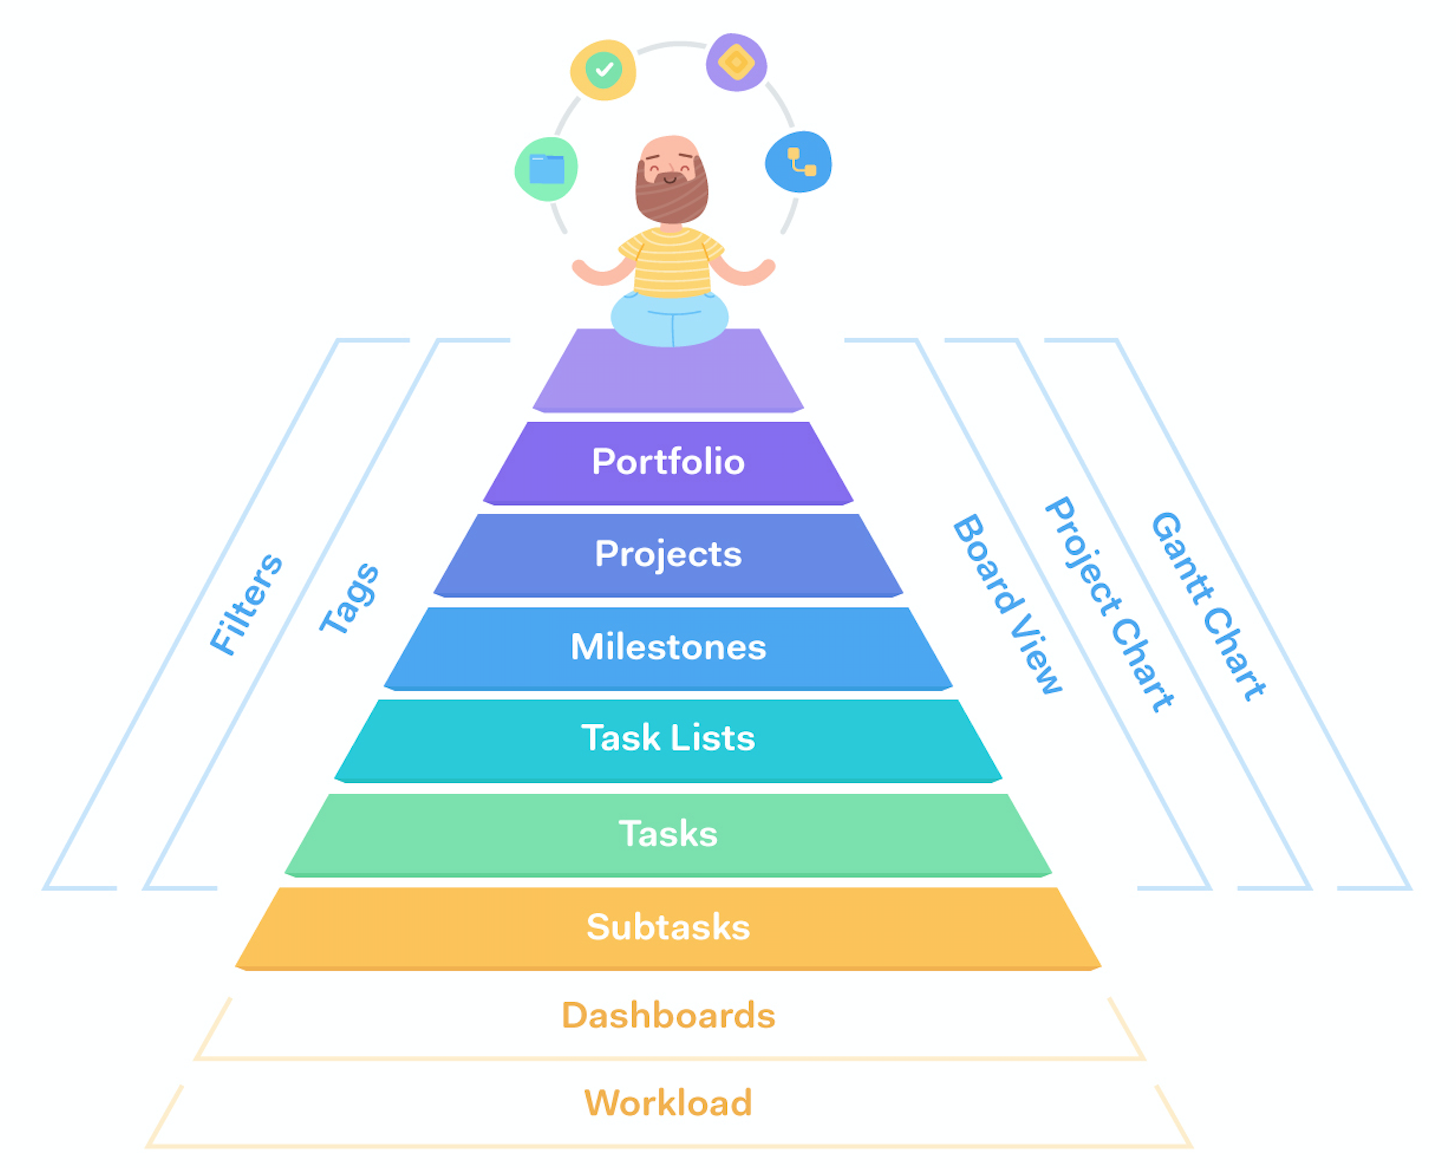
Within the Home area of your site, you can build custom dashboard views using different metrics based on certain projects and project items.
These dashboards allow you to drill down further into your projects and gain deeper insights into the work.
The workload gives you an overview of where and when your site's resources (people) are allocated based on the tasks they are assigned to and the estimated time of those tasks.
The tasks included in the workload are dependent on a number of conditions, such as estimated time, start dates, and due dates.
For more information, see: Features and Tips