
✔
Available
on Grow and Scale
subscriptions. 1
| What | Review and report on
your team's
time. |
| Why |
|
| Who |
|
| When | Review tracked and billed
time in
line with your company's
processes. Ex.
Conduct
payroll on a monthly
basis? Check the
report ahead of the end of the
month to ensure that the
period's time is properly
accounted for. |
| What | Review and report on
your team's
time. |
| Why |
|
| Who |
|
| When | Review tracked and billed
time report in
line with your company's
processes. Ex.
Conduct
payroll on a monthly
basis? Check the
report ahead of the end of the
month to ensure that the
period's time is properly
accounted for. |
View the
time report
- Select Reports in Teamwork.com's main navigation menu.
- Scroll to the Teamwork
reports section.
- Select Time. Alternatively,
use the search field to
locate the
report.

Bar
chart
The bar chart is a
visual representation
of billable, non-billable, and
billed time over a given
period.
- Hover over a period to view
the associated breakdown of
hours.
- Click the labels at the top of
the chart to show or hide
billable, non-billable, or
billed time from the
chart.
| Color | Description | Purpose |
|---|---|---|
 | Dark blue bar | Billable: Total
billable time logged
across all
users (or all
filtered users)
in the given time
period. |
 | Light blue
bar | Non-billable: Total non-billable
time
across all users
(or all
filtered users) in
the given
time period. |
 | Pink
bar | Billed: Total
time across all
users' (or all
filtered
users') assigned
tasks in the
given time
period that has been
marked as billed (aka
added to an
invoice). |
| Color | Description | Purpose |
|---|---|---|
| Dark blue bar | Billable: Total
billable time logged
across all
users (or all
filtered users)
in the given time
period. |
| Light blue
bar | Non-billable: Total non-billable
time
across all users
(or all
filtered users) in
the given
time period. |
| Pink
bar | Billed: Total
time across all
users' (or all
filtered
users') assigned
tasks in the
given time
period that has been
marked as billed (aka
added to an
invoice). |
Gauge
chart
The gauge chart
represents the
percentage split of
billable and
non-billable time
within the applied
date range and
filters.
The total
number
of
billable, non-billable
and overall total
hours are displayed
below the
gauge.

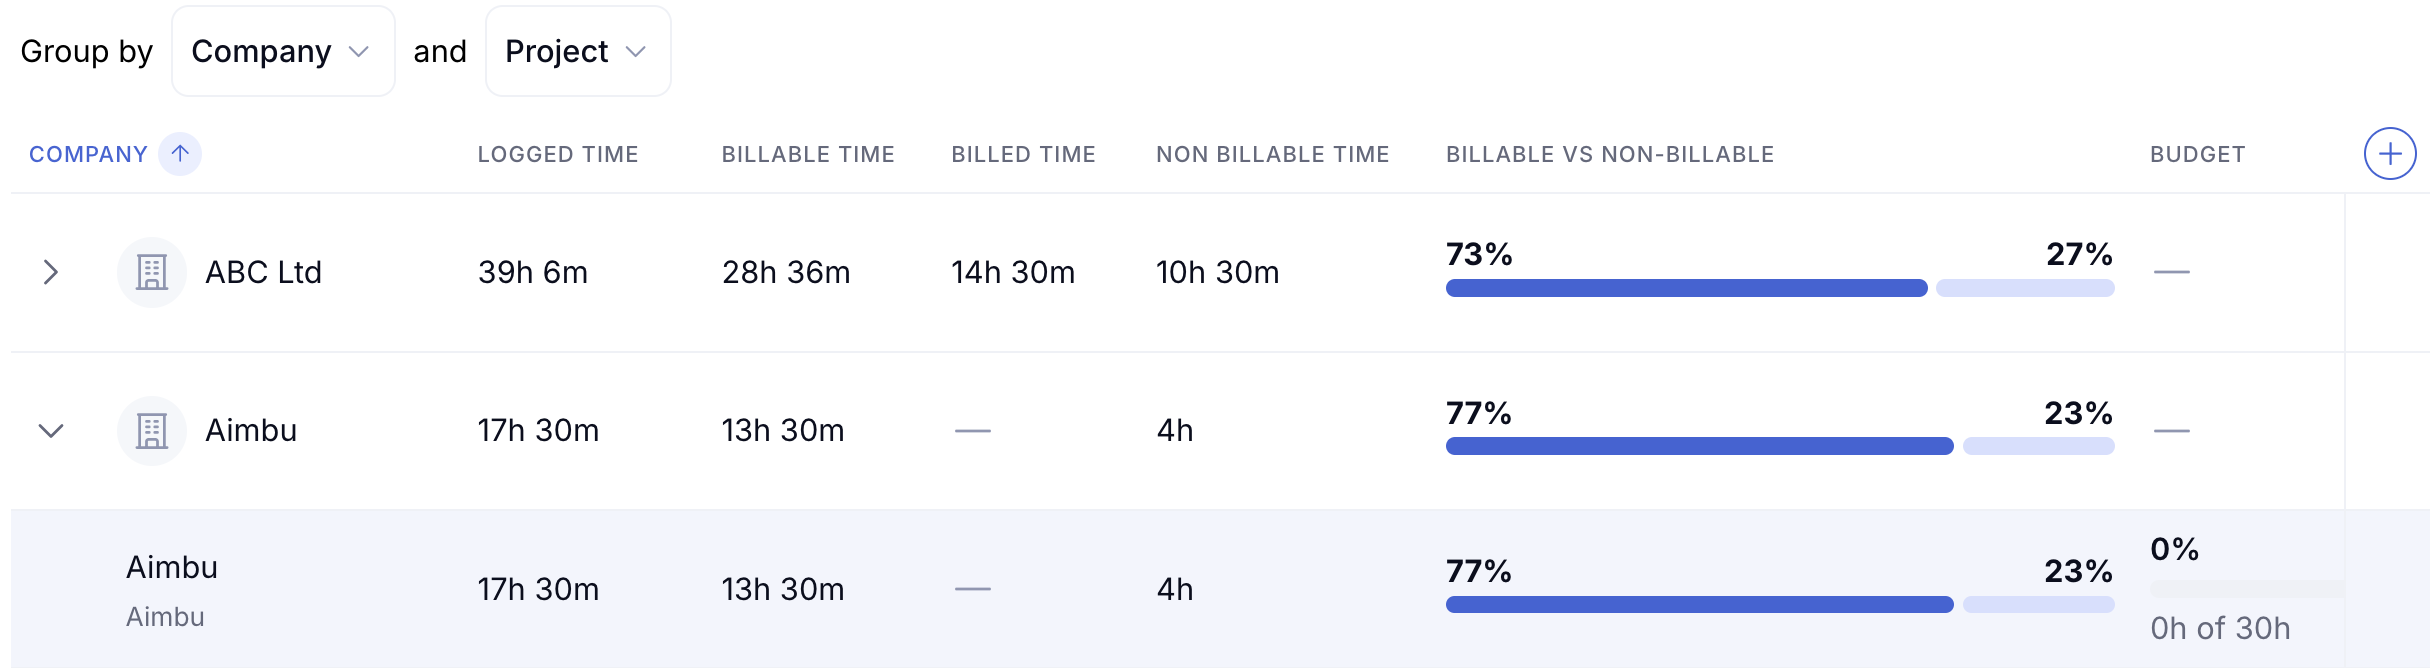
Time logs
table
The time logs table is a
customizable time report
based on live data.
Each top-level row of the report
shows the total (in hours) for your chosen
primary group. Click the arrows on the left to expand a primary group (ex. a company) and view the totals based on your secondary grouping (ex. project).
Grouping
options
| Primary
grouping | Secondary
grouping
options | |||||
|---|---|---|---|---|---|---|
Company | Project | Task
list | Task | Team | User | |
| Company | ✗ | ✔ | ✔ | ✔ | ✔ | ✔ |
| Project | ✗ | ✗ | ✔ | ✔ | ✔ | ✔ |
| Task list | ✗ | ✗ | ✗ | ✔ | ✔ | ✔ |
| Task | ✗ | ✗ | ✗ | ✗ | ✔ | ✔ |
| Team | ✔ | ✔ | ✔ | ✔ | ✗ | ✔ |
| User | ✔ | ✔ | ✔ | ✔ | ✗ | ✗ |
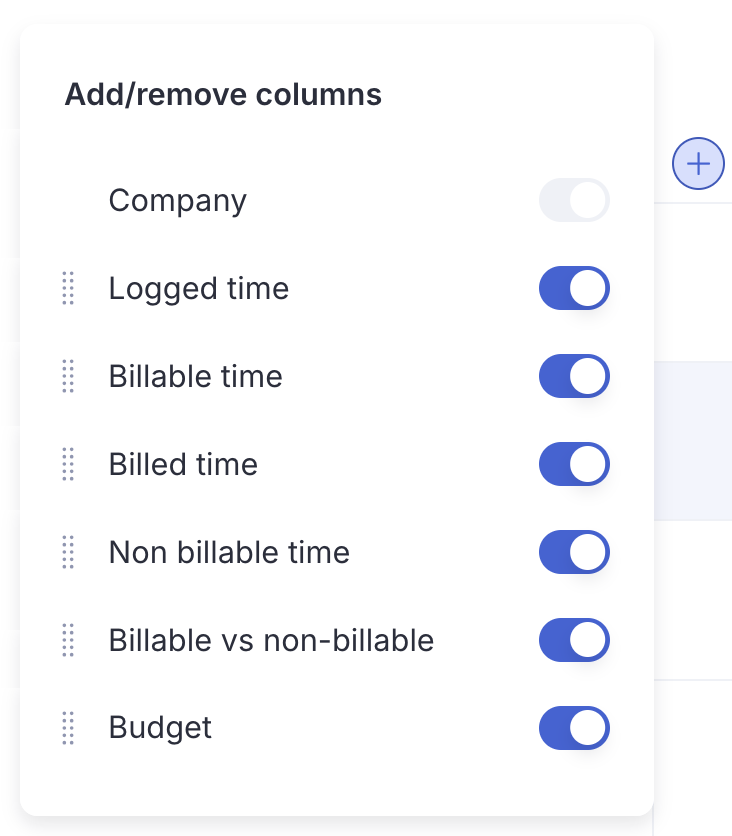
Customize
columns
- Click the plus icon on the
header row's right.
- Next:
- Show/hide: Toggle on (and off) individual property columns.📝 The budget column is available when the primary grouping is set to company or project.
- Reorder: Click and hold a column heading, then drop it to a new position in the table.
- Resize: Hover on a column heading's right to reveal a left-right arrow. Drag the arrow left or right to expand or contract the column's width.
- Sort: Click a column heading to sort the time logs based on that property. Select the same column heading again to switch from ascending to descending order.
Search and
filter
Search
Use the
search field in
the report's top
right to refine
the data shown in
each section of
the report.
📝 Search is linked
with the primary grouping
field in the time logs table section. Ex. if
grouping is set to "Company," search is based
on company.
Filter
Use
filters to refine
the report to show
the information
most relevant to
you.
- Click
the Filter button
in the
report's top
right.
- Select the option you want to filter by (ex. projects).📝 Filters are linked with the grouping fields in the time logs table section. Only filters supported with the active grouping are selectable.
- Choose the corresponding filter criteria (ex. "Project ABC," "Project DEF").
- Filter based on: user, project, task list, teams, company.
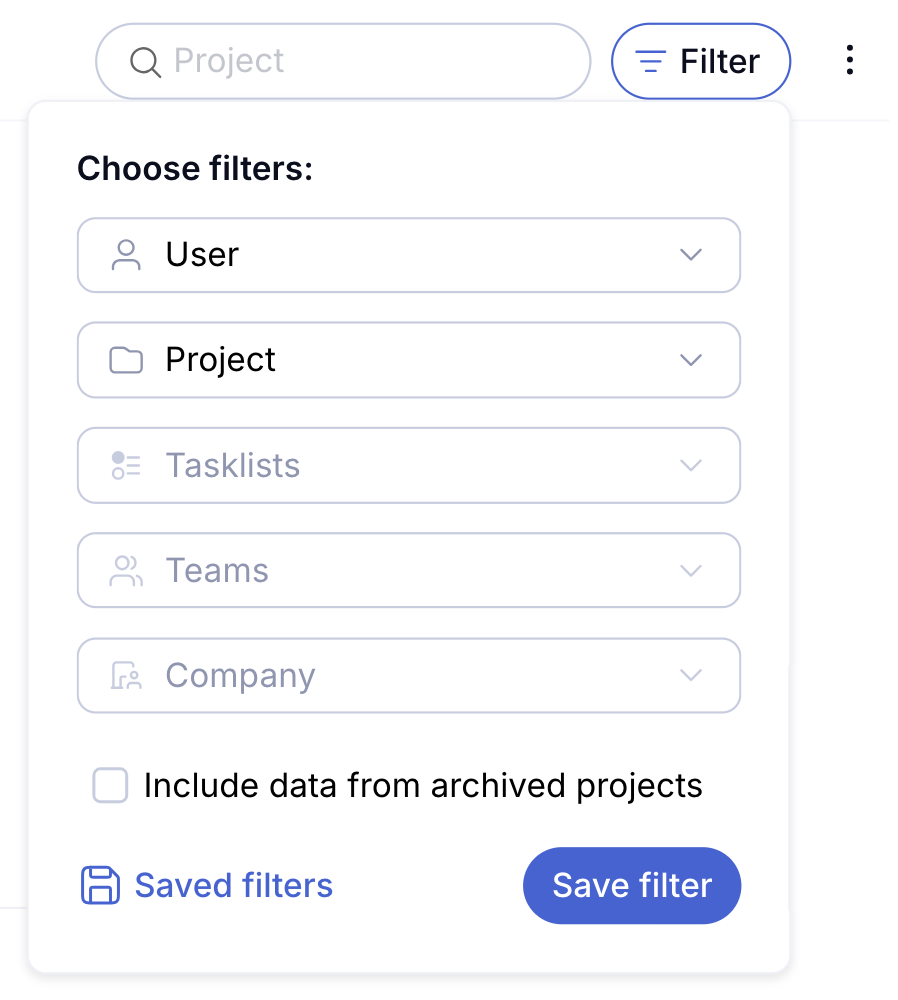
- Next:
- Save filter: Click Save filter to save the current criteria for quick application in the future.
- Clear: Click Clear all in the filter menu to remove any active filters.
Export the
time report
Export the
profitability report to a
shareable format.
- Click Reports from
Teamwork's
main navigation menu.
- Select the Profitability report.
- Click the filter button
(
 )
in the
report's top right and choose any
relevant criteria you want to filter
by. This is optional but
allows you to create a tailored
report.
)
in the
report's top right and choose any
relevant criteria you want to filter
by. This is optional but
allows you to create a tailored
report. - Click the ... (ellipsis)
in
the report's top right.
- Select Export.
- Choose an export format:
- PDF
- CSV
- Excel
- Google Sheets (available on Deliver, Grow, and Scale subscriptions)
The export is downloaded to
your
device.
Best
practices
- Review
and
analyze:
Schedule
routine
reviews
of
the time
report
to
identify
trends and
gaps in
how time
is being
spent.
- Customize
for
clarity:
Tailor the
time
report
using
groupings
and
filters
to
align
with your
priority
focus
areas (ex.
specific
clients or
projects).
1.
Also
available
on
legacy
subscriptions:
Premium,
Enterprise.