
Within Teamwork.com, you can view a project's tasks and milestones in a Gantt-style view.
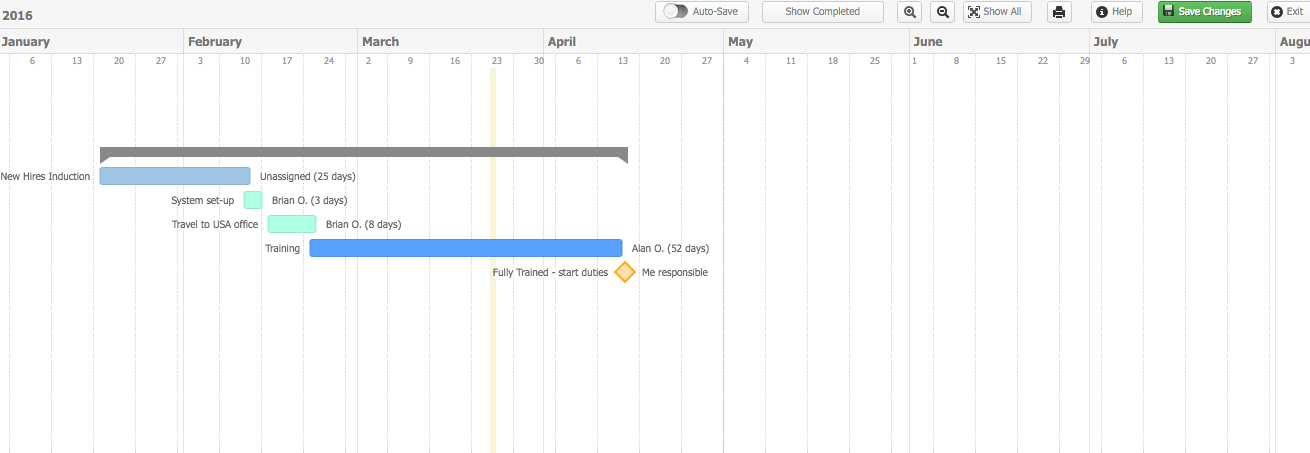
A Gantt chart is a visual representation of the overall project timeline.
Tasks are represented in a bar format showing task duration, which is based on the difference between the start date and due date.
Note: This is always calculated including weekends.
You will also see who tasks are assigned to. Each user is automatically assigned a color which will be used when displaying their assigned tasks. A line representing the duration of an entire task list from the start date of the first task to the due date of the latest one will be displayed above any associated tasks.
Milestones attached to task lists will also display on the Gantt chart.
Note: This gantt chart view is only available at individual project level.
For more information, see: Viewing Your Project in a Gantt Chart